Overseilingsoppgave D1/WW – No 03
Av Øystein Johnsen
Sjøkaptein MNI, Assessor
Overseilingsoppgave D1 – No 03
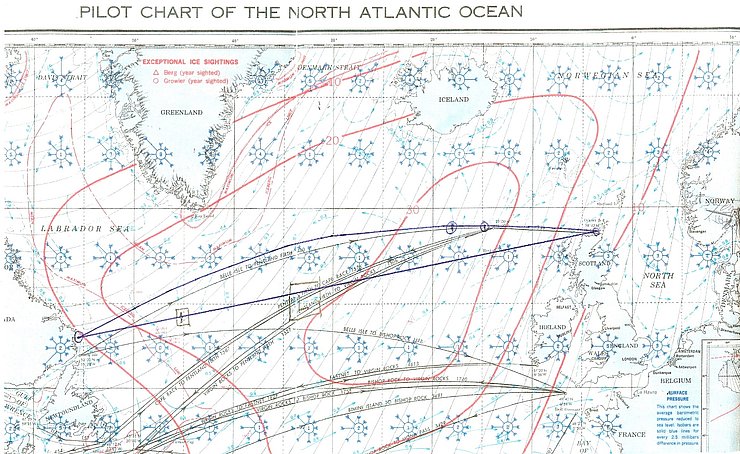
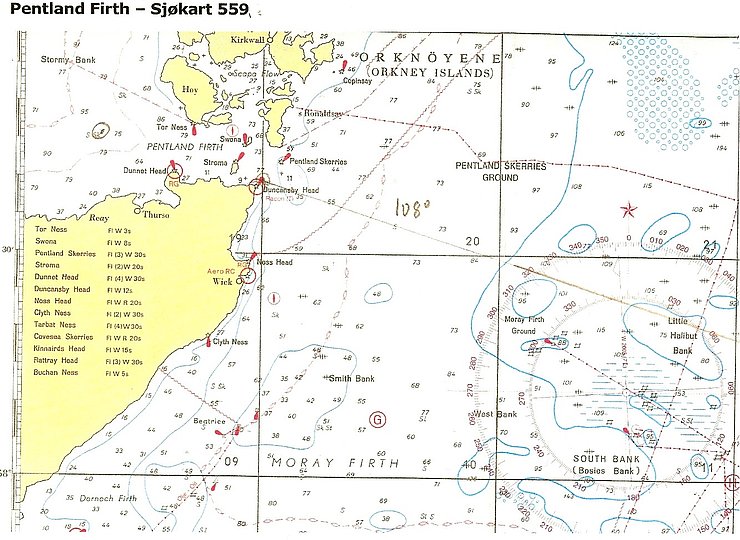
Kart 559, Pilot Chart North Atlantic, Gnomonic Chart North Atlantic
 Vedlegg


 WAVE FORECASTING BY MANUAL METHODS
Figure 4.1 shows the OD curves for deep water. Thick dark lines represent the growth of waves along increasing fetch, which is shown by thin oblique lines. Each thick line corresponds to a constant wind speed. The characteristic wave height,
Hc, is obtained from the horizontal lines and the characteristic period
Tc from the dotted lines. The vertical lines indicate duration at which that stage of development will be reached. If the duration is limited, the waves will not develop along the thick dark lines beyond that point irrespective of the fetch length.
It should be noted that the curves are nearly horizontal on the rightside of the diagram. This implies that for a given wind speed, the waves stop growing when the duration or fetch is long enough.
Løsningsforslag
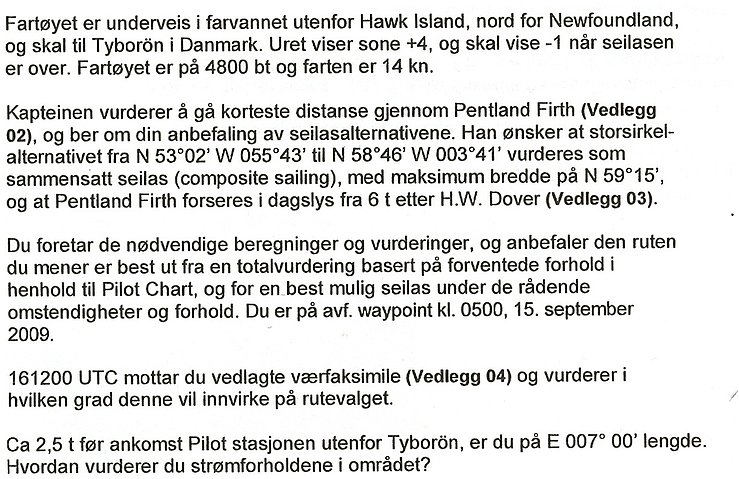
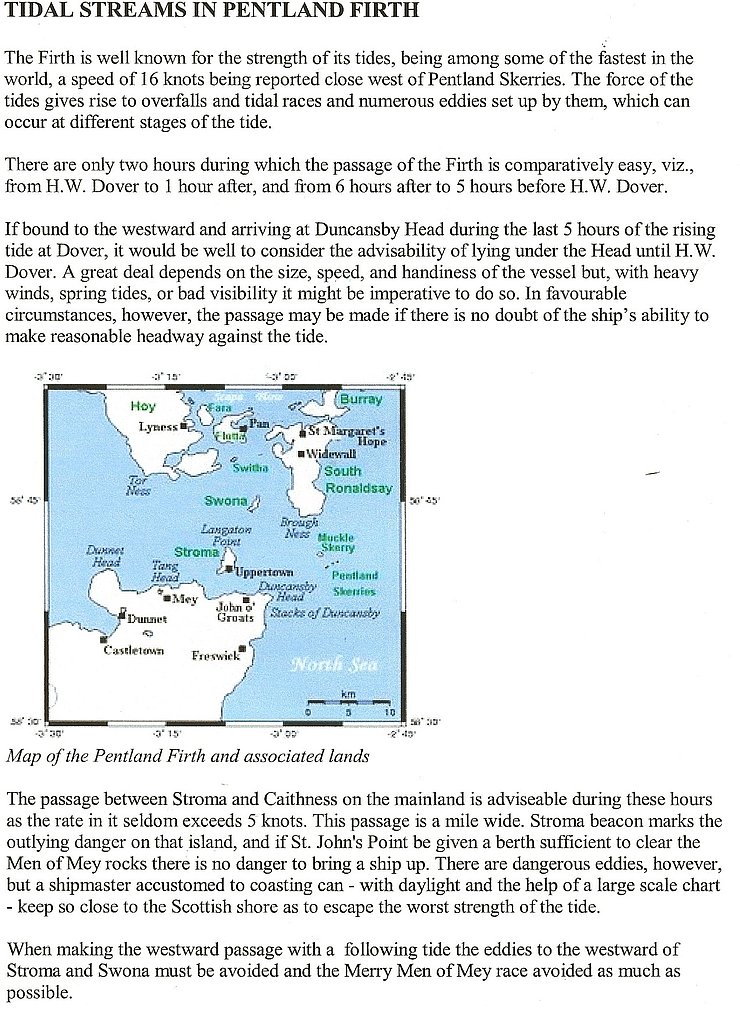
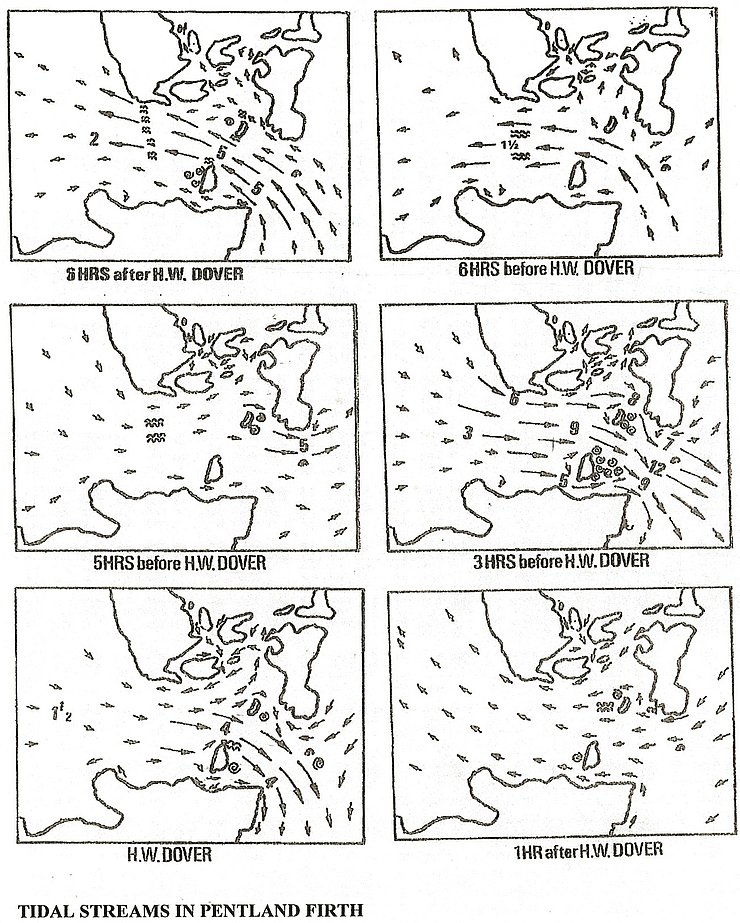
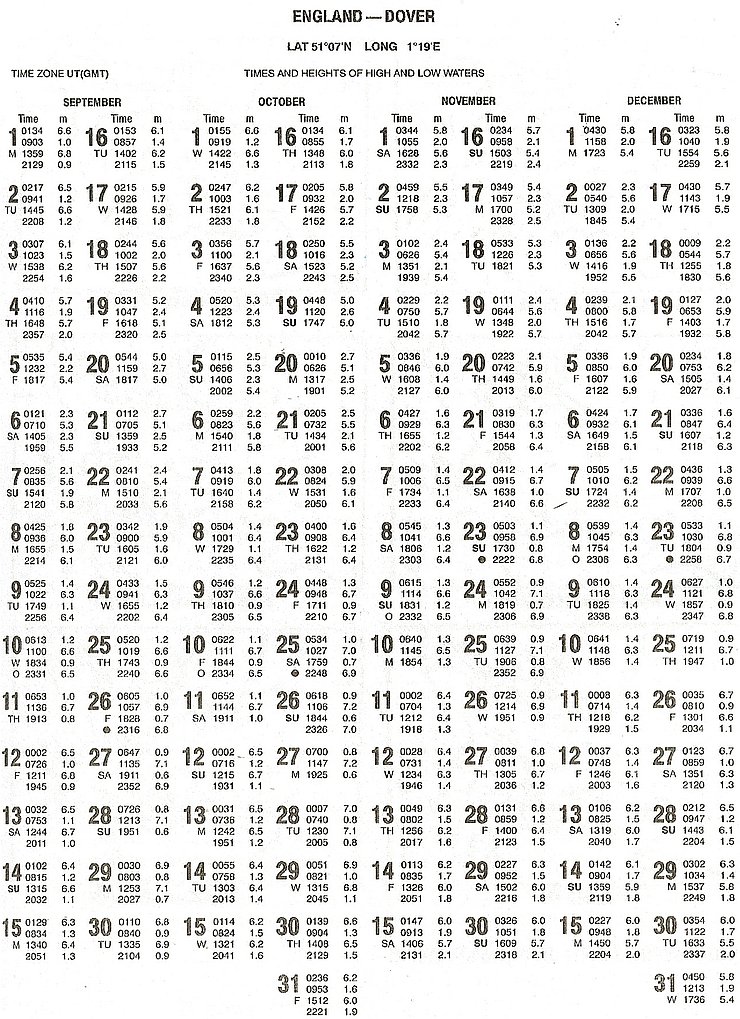
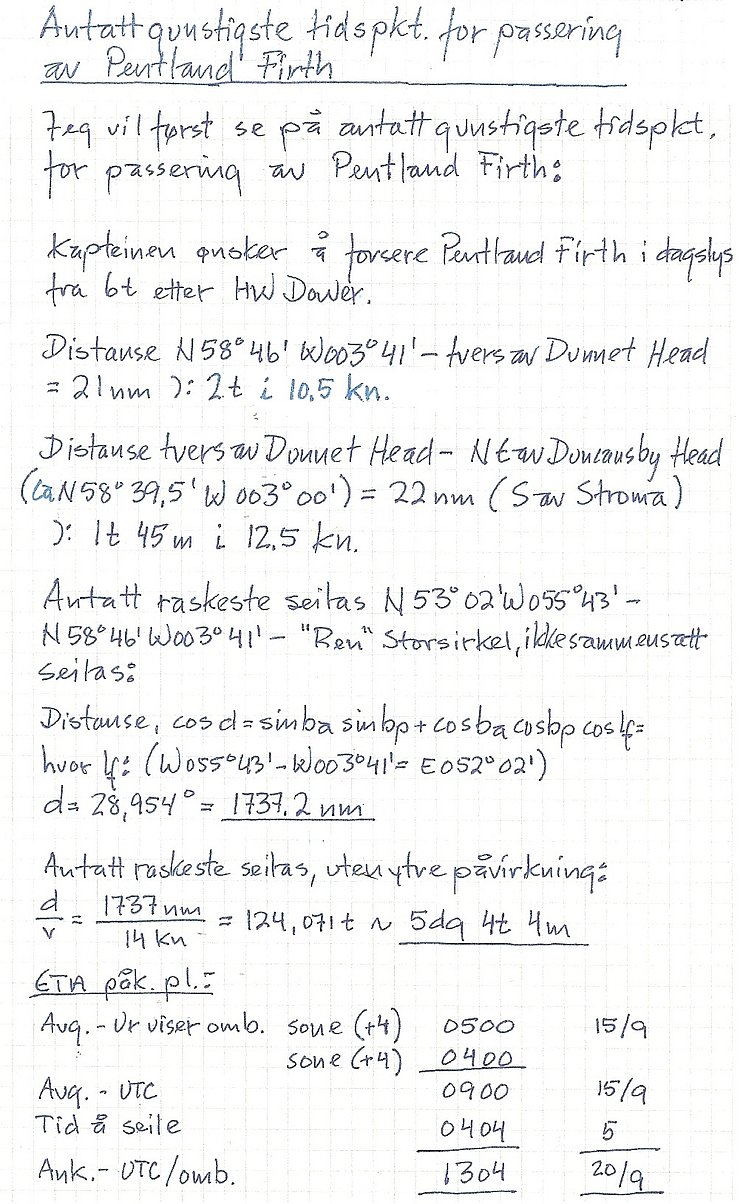
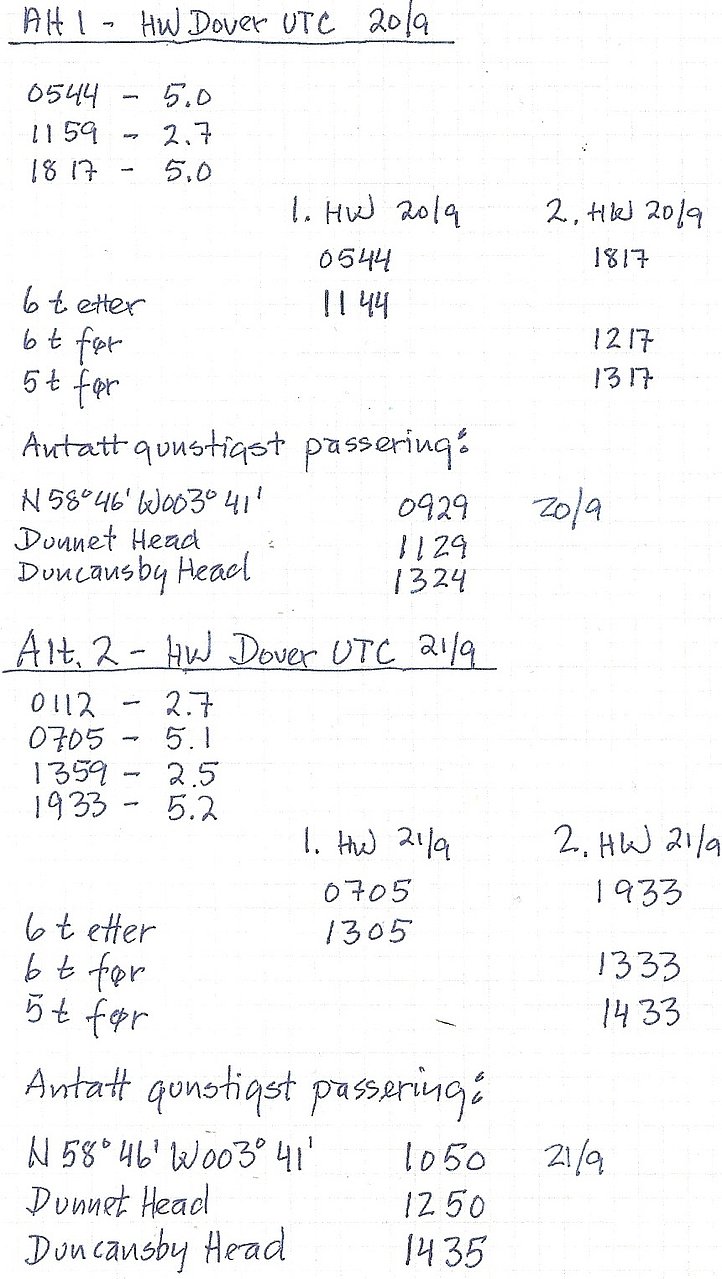
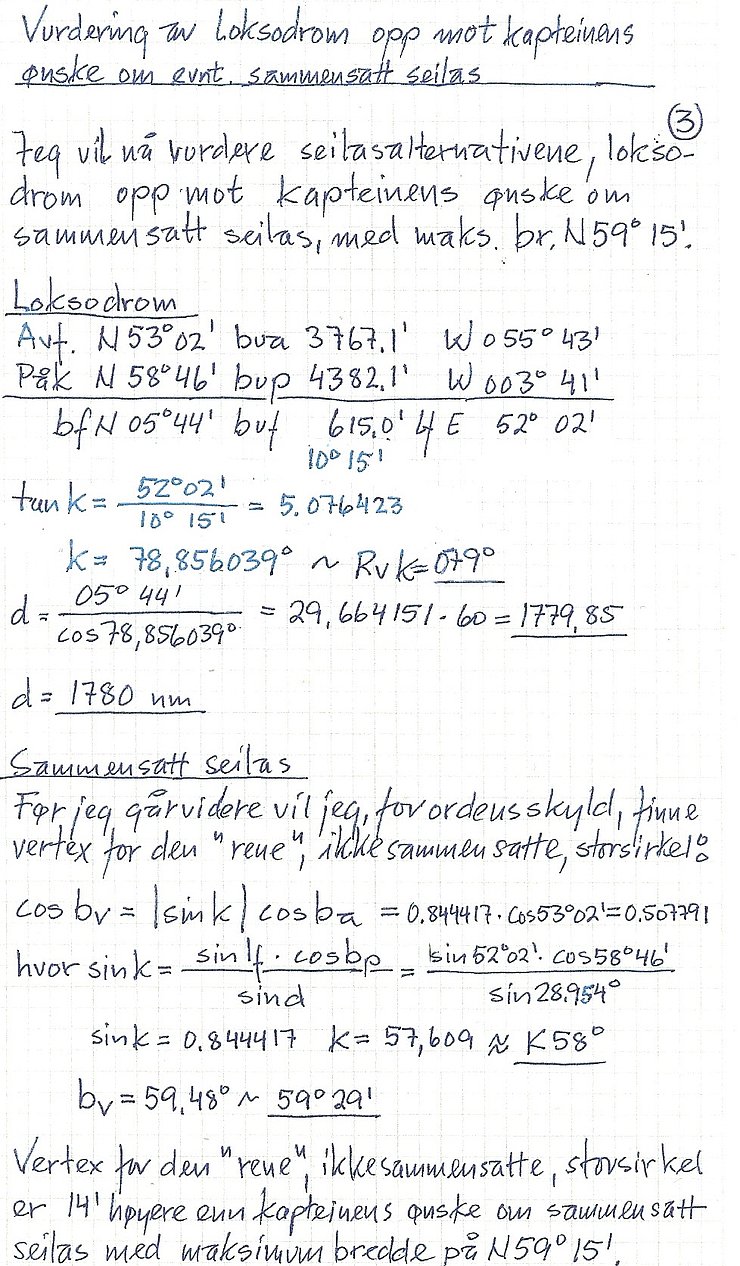
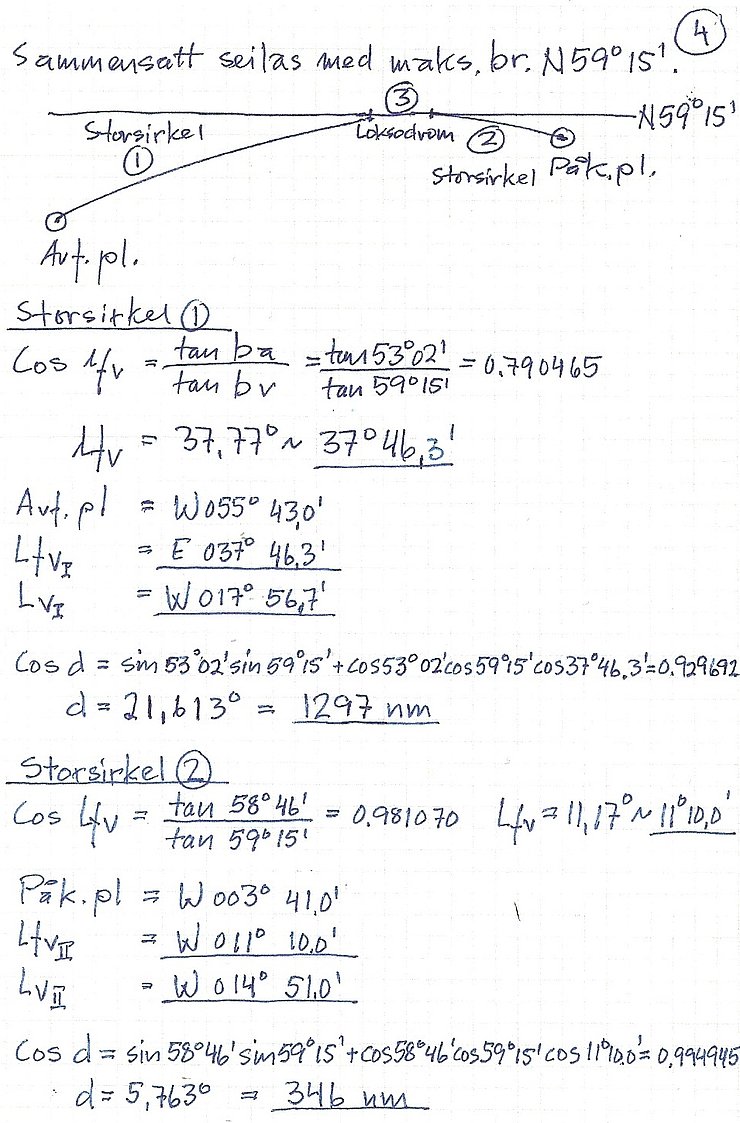
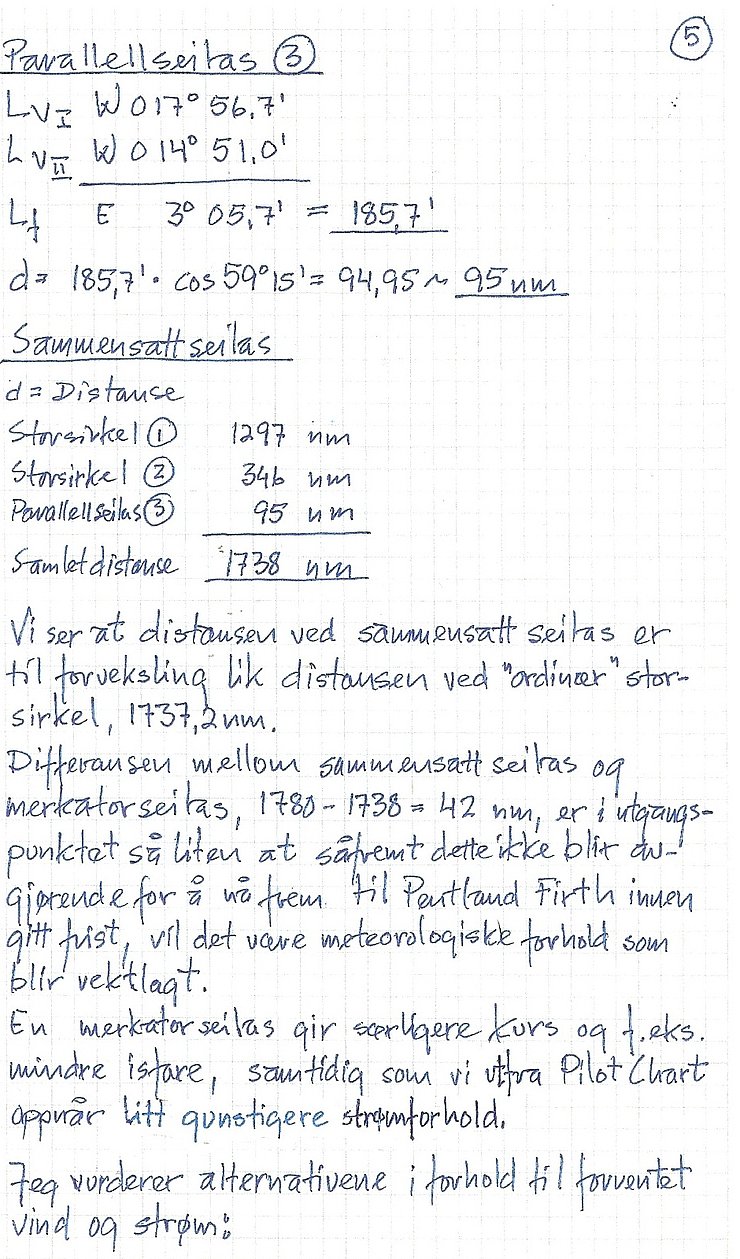
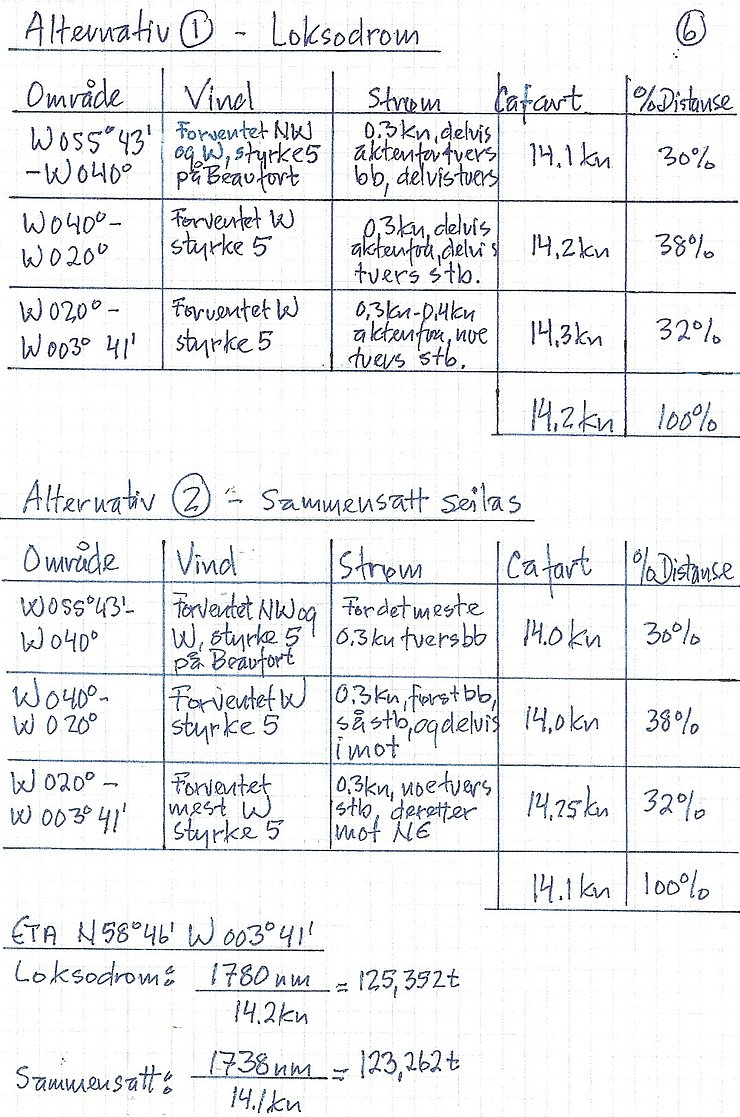
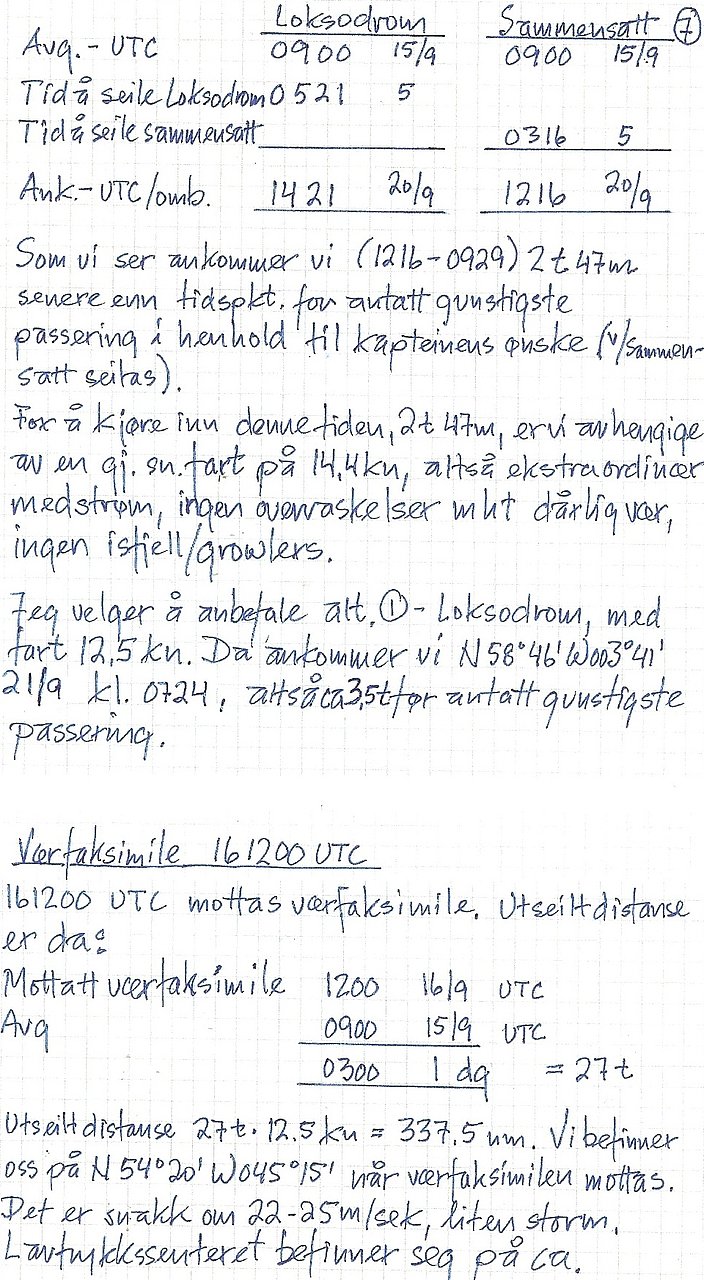
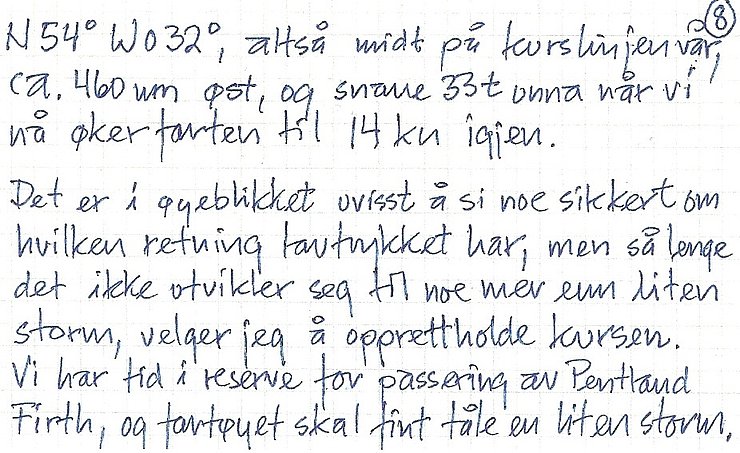
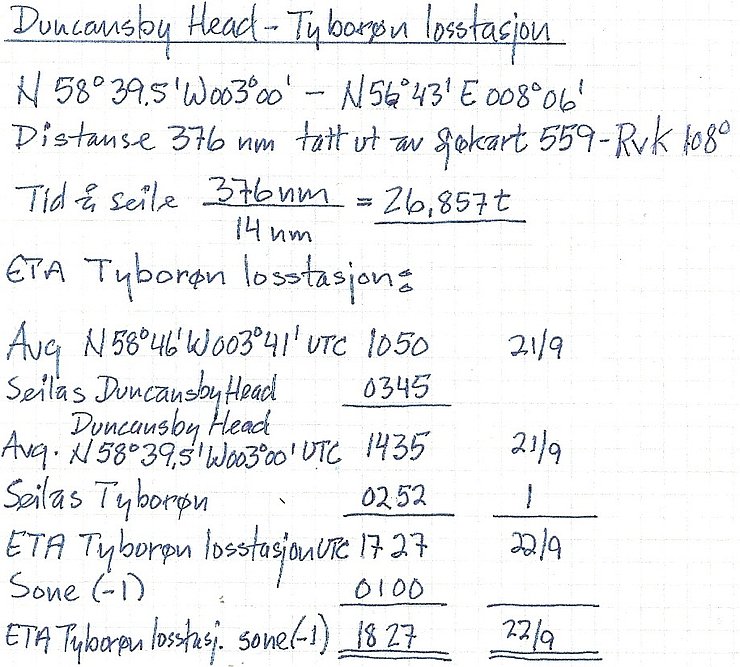
Dette er en delvis åpen oppgave, som også gir føringer for maksimum breddeseilas, og ønske om forsering av Pentlandstredet i dagslys fra 6 timer etter H.W. Dover.


 Vedlegg


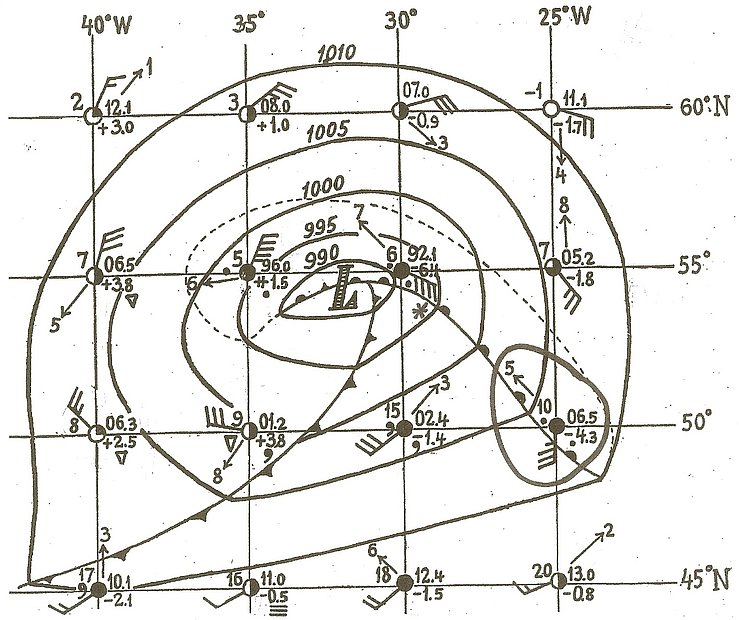
Værfaksimile


 16.06.2010 © Øystein Johnsen
 Vedlegg

 WAVE FORECASTING BY MANUAL METHODS
Figure 4.1 shows the OD curves for deep water. Thick dark lines represent the growth of waves along increasing fetch, which is shown by thin oblique lines. Each thick line corresponds to a constant wind speed. The characteristic wave height, Hc, is obtained from the horizontal lines and the characteristic period Tc from the dotted lines. The vertical lines indicate duration at which that stage of development will be reached. If the duration is limited, the waves will not develop along the thick dark lines beyond that point irrespective of the fetch length.
It should be noted that the curves are nearly horizontal on the rightside of the diagram. This implies that for a given wind speed, the waves stop growing when the duration or fetch is long enough.
 Vedlegg

 16.06.2010 © Øystein Johnsen